Pivot tables and pivot charts
EPPlus supports both creating new and updating existing pivot tables in a workbook. Pivot tables are created and altered via the PivotTables collection in the ExcelWorksheet class.
Add a pivot table
Here is an example of how a pivot table can be added to a workbook:
var wsPivot = pck.Workbook.Worksheets.Add("PivotSimple");
var pivotTable1 = wsPivot.PivotTables.Add(wsPivot.Cells["A1"], dataRange, "PerCountry");

pivotTable1.RowFields.Add(pivotTable1.Fields["Country"]);
var dataField = pivotTable1.DataFields.Add(pivotTable1.Fields["OrderValue"]);
dataField.Format="#,##0";
pivotTable1.DataOnRows = true;
Dim wsPivot = pck.Workbook.Worksheets.Add("PivotSimple")
Dim pivotTable1 = wsPivot.PivotTables.Add(wsPivot.Cells("A1"), dataRange, "PerCountry")

pivotTable1.RowFields.Add(pivotTable1.Fields("Country"))
Dim dataField = pivotTable1.DataFields.Add(pivotTable1.Fields("OrderValue"))
dataField.Format = "#,##0"
pivotTable1.DataOnRows = True
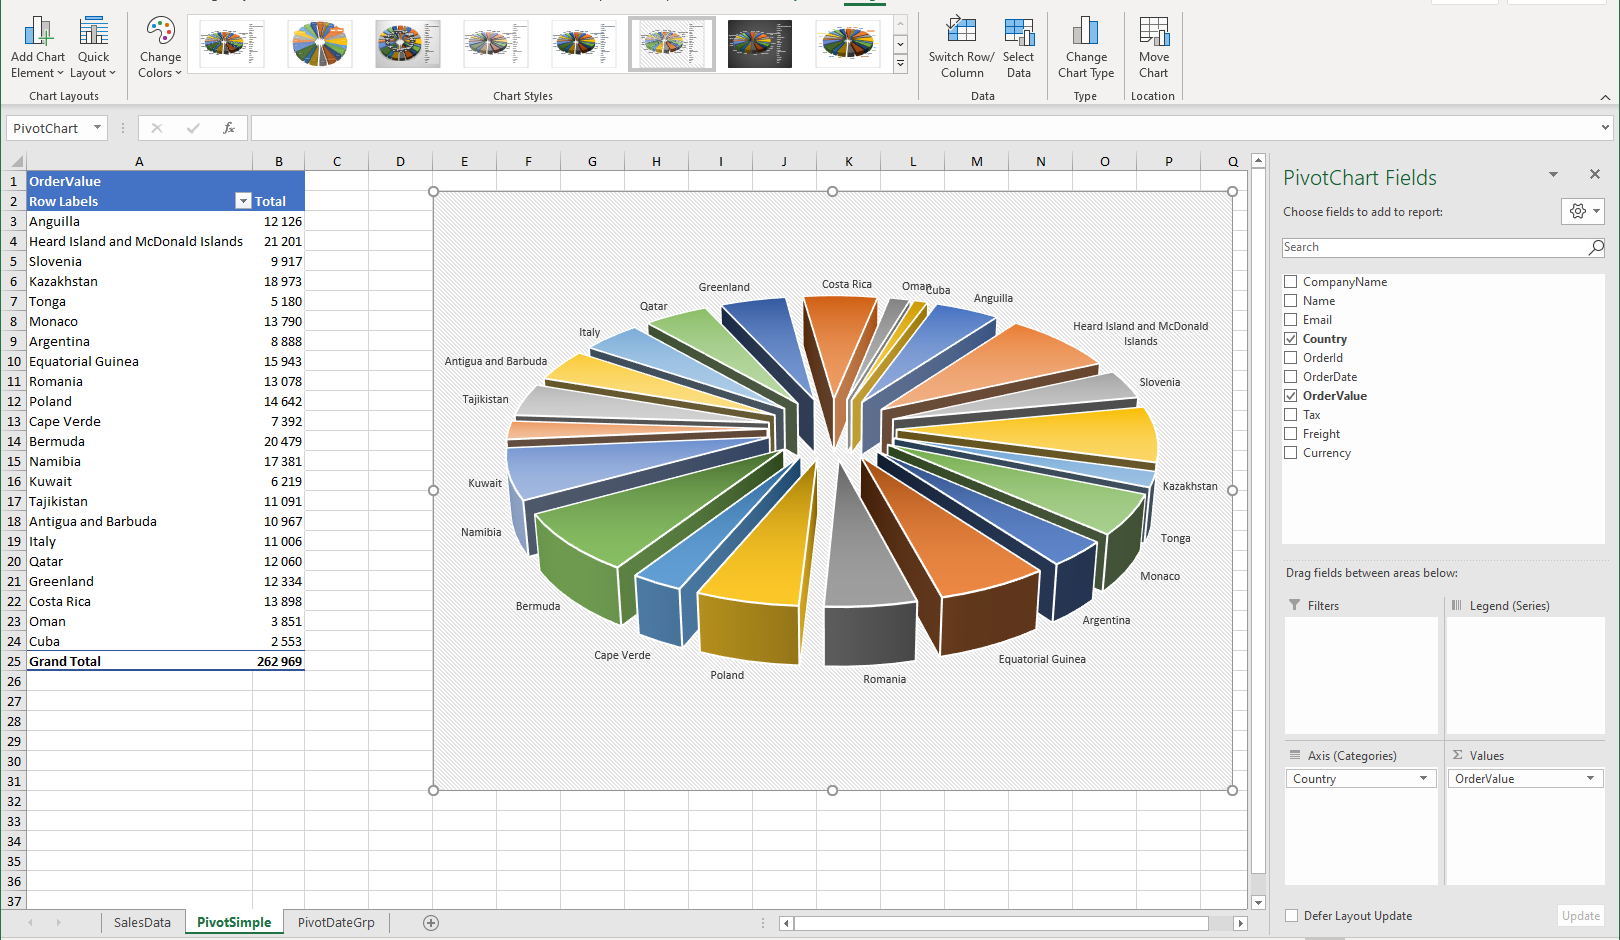
In this example a pivot table will be created starting from cell A1. One row field and one data field is added. You can also add column fields and page fields.
Add a pivot chart
When you have created a pivot table you can easily create a pivot chart on the pivot table:
var chart = wsPivot.Drawings.AddPieChart("PivotChart", ePieChartType.PieExploded3D, pivotTable1);
chart.SetPosition(1, 0, 4, 0);
chart.SetSize(800, 600);
chart.Legend.Remove();
chart.Series[0].DataLabel.ShowCategory = true;
chart.Series[0].DataLabel.Position = eLabelPosition.OutEnd;
chart.StyleManager.SetChartStyle(ePresetChartStyle.Pie3dChartStyle6);
Dim chart = wsPivot.Drawings.AddPieChart("PivotChart", ePieChartType.PieExploded3D, pivotTable1)
chart.SetPosition(1, 0, 4, 0)
chart.SetSize(800, 600)
chart.Legend.Remove()
chart.Series(0).DataLabel.ShowCategory = True
chart.Series(0).DataLabel.Position = eLabelPosition.OutEnd
chart.StyleManager.SetChartStyle(ePresetChartStyle.Pie3dChartStyle6)
Here we create a 3D exploded pie chart on the data, setting the style to preset style 6.
Pivot charts are added as normal charts via the Add[Chart type]Chart methods in the Drawings Collection as described here. The pivot table is added as argument three of this method.
Restrictions of pivot tables sources.
EPPlus do not update connections to external workbooks, data models or connections.
See also
External connections & query tables (introduced in EPPlus 8.3) for using pivot tables with an external connection.