Sparklines
Sparklines
Sparklines are small in-cell charts rendered in the fill area of a cell and are added in groups via the ExcelWorksheet.SparklineGroups collection.
EPPlus supports sparklines of the following types:
- Line
- Column
- Stacked (Called Win/Loss in Excel)
You can highlight different points like high, low, first, last or negative values.
The Stacked sparkline uses some random data to shows up in the last cell of row 17.
The below code is from sample 5.4 C#/Visual Basic.
As sample data we use FX rates:
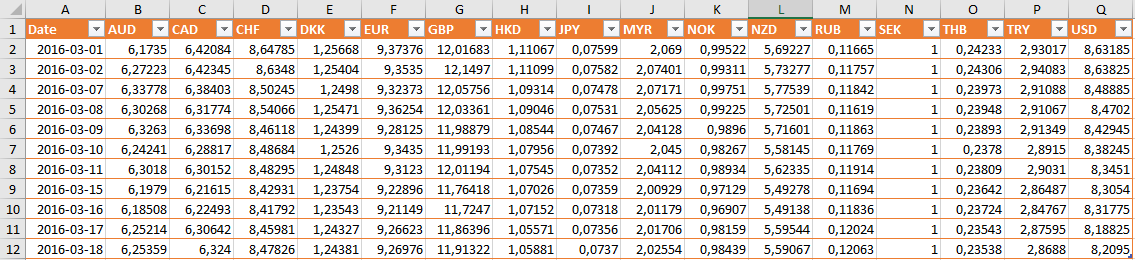
This sample adds the three different sparkline types:
// Adds a column sparkline for all currencies
ws.Cells["A15"].Value = "Column";
var sparklineCol = ws.SparklineGroups.Add(eSparklineType.Column, ws.Cells["B15:Q15"], ws.Cells["B2:Q12"]);
sparklineCol.High = true;
sparklineCol.ColorHigh.SetColor(Color.Red);

// Add a line sparkline for  all currencies
ws.Cells["A16"].Value = "Line";
var sparklineLine = ws.SparklineGroups.Add(eSparklineType.Line, ws.Cells["B16:Q16"], ws.Cells["B2:Q12"]);
sparklineLine.DateAxisRange = ws.Cells["A2:A12"];

// Add some more random values and add a stacked sparkline.
ws.Cells["A17"].Value = "Stacked";
ws.Cells["B17:Q17"].LoadFromArrays(new List<object[]> { new object[] { 2, -1, 3, -4, 8, 5, -12, 18, 99, 1, -4, 12, -8, 9, 0, -8 } });
var sparklineStacked = ws.SparklineGroups.Add(eSparklineType.Stacked, ws.Cells["R17"], ws.Cells["B17:Q17"]);
sparklineStacked.High = true;
sparklineStacked.ColorHigh.SetColor(Color.Red);
sparklineStacked.Low = true;
sparklineStacked.ColorLow.SetColor(Color.Green);
sparklineStacked.Negative = true;
sparklineStacked.ColorNegative.SetColor(Color.Blue);
' Adds a column sparkline for all currencies
ws.Cells("A15").Value = "Column"
Dim sparklineCol = ws.SparklineGroups.Add(eSparklineType.Column, ws.Cells("B15:Q15"), ws.Cells("B2:Q12"))
sparklineCol.High = True
sparklineCol.ColorHigh.SetColor(Color.Red)

' Add a line sparkline for  all currencies
ws.Cells("A16").Value = "Line"
Dim sparklineLine = ws.SparklineGroups.Add(eSparklineType.Line, ws.Cells("B16:Q16"), ws.Cells("B2:Q12"))
sparklineLine.DateAxisRange = ws.Cells("A2:A12")

' Add some more random values and add a stacked sparkline.
ws.Cells("A17").Value = "Stacked"
ws.Cells("B17:Q17").LoadFromArrays(New List(Of Object()) From {New Object() {2, -1, 3, -4, 8, 5, -12, 18, 99, 1, -4, 12, -8, 9, 0, -8}})
Dim sparklineStacked = ws.SparklineGroups.Add(eSparklineType.Stacked, ws.Cells("R17"), ws.Cells("B17:Q17"))
sparklineStacked.High = True
sparklineStacked.ColorHigh.SetColor(Color.Red)
sparklineStacked.Low = True
sparklineStacked.ColorLow.SetColor(Color.Green)
sparklineStacked.Negative = True
sparklineStacked.ColorNegative.SetColor(Color.Blue)
