EPPlus 9 preview SVG
Preview released 2026-09-22Export charts and shapes as scalable vector graphics with EPPlus 9
Charts and shapes as crisp SVG
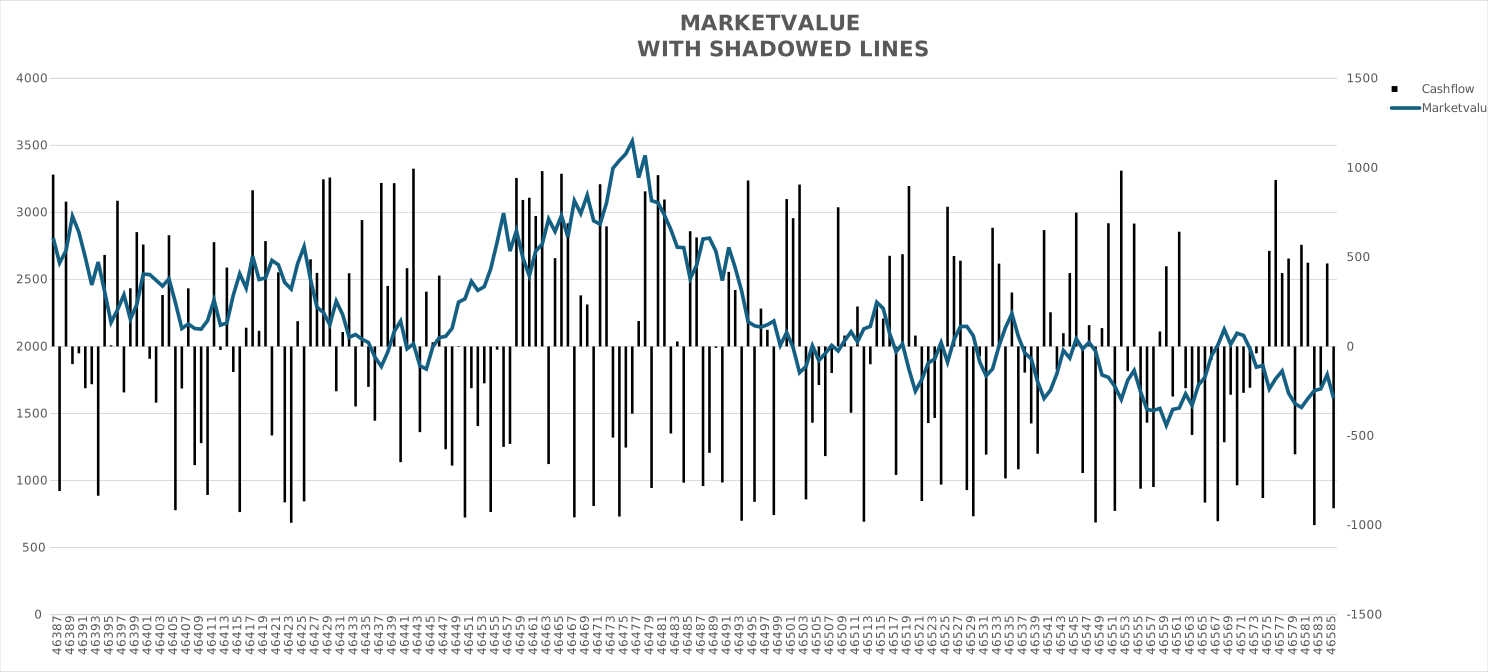
With EPPlus 9 you can now export shapes and pie-, column-, bar- and line charts from your workbook directly to SVG — Scalable Vector Graphics. Unlike raster formats like PNG or JPEG, SVG images stay perfectly sharp at any size, from a small thumbnail to a full-screen dashboard. This makes SVG the ideal format for web reports, print-ready documents, and modern user interfaces where visual quality matters. The conversion happens in-memory with a single method call, so you can generate previews, embed graphics in emails, or ship them straight to the browser without touching Excel.
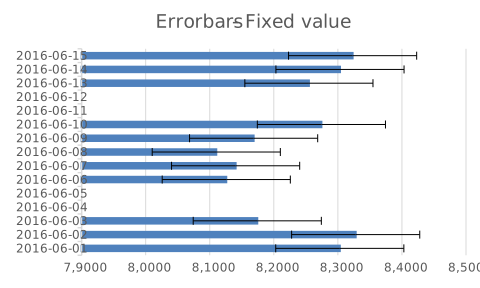
Most chart elements — data labels, trend lines, error bars, and more — are supported.. The output is standards-compliant SVG that works in every modern browser and vector editor.
How it works
Simply call ToSvg() on a drawing in your worksheet to get the SVG markup as a string. From there you can save it to disk, stream it to a response, or embed it inline in an HTML page. No external dependencies, no rendering engines to configure — it just works.
Try it yourself
Explore our interactive sample where you can tweak parameters and generate SVGs
Open interactive sample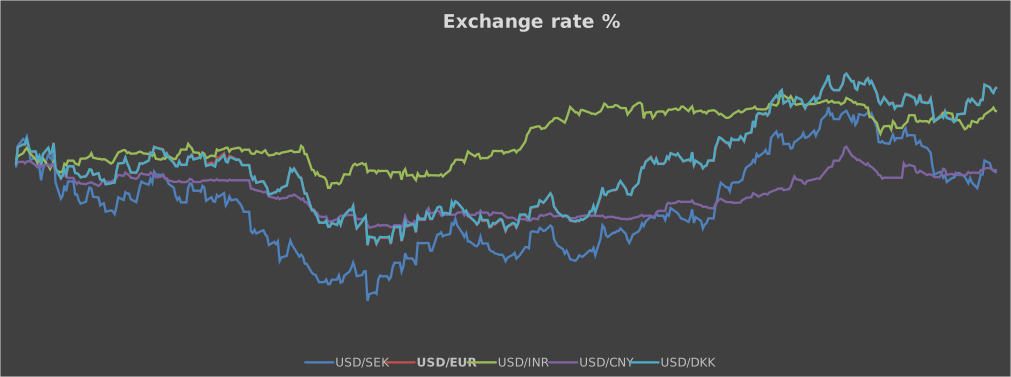
See it in action
Below are examples of SVGs generated directly from an Excel workbook using EPPlus 9. The lines stay crisp at any level.