EPPlus 5/6
Features - charts
Charts in EPPlus 5/6
EPPlus 5/6 has many new chart types and possibilities to style them compared to previous versions. All the examples below are screenshots from workbooks created with EPPlus 5/6 in our Sample projects.
These workbooks are from sample 15 and are available for download below.
Our sample project can be found here.
.NET Core ,
.NET Framework
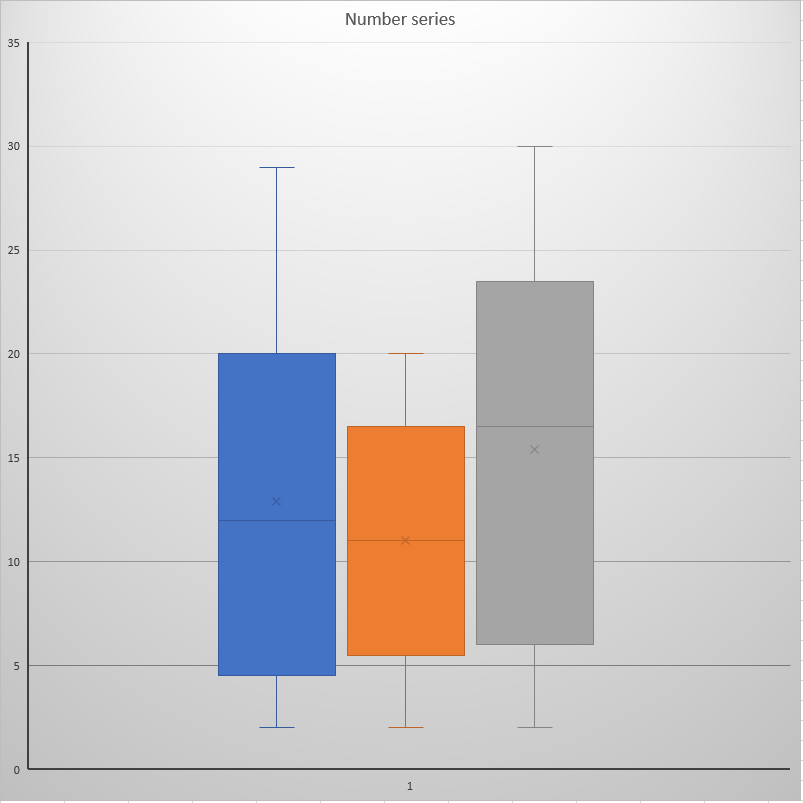
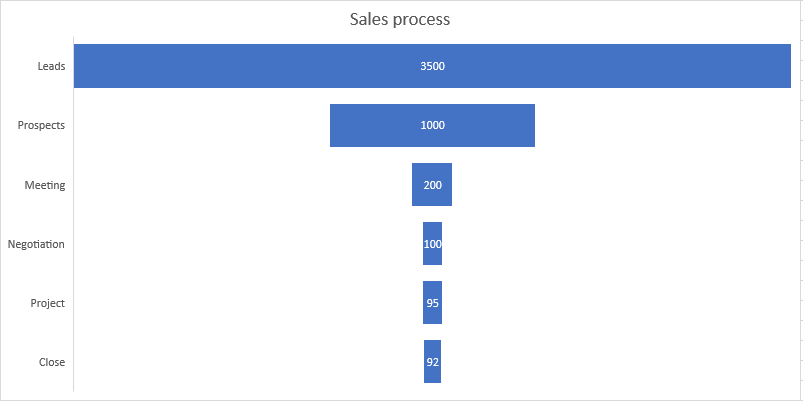
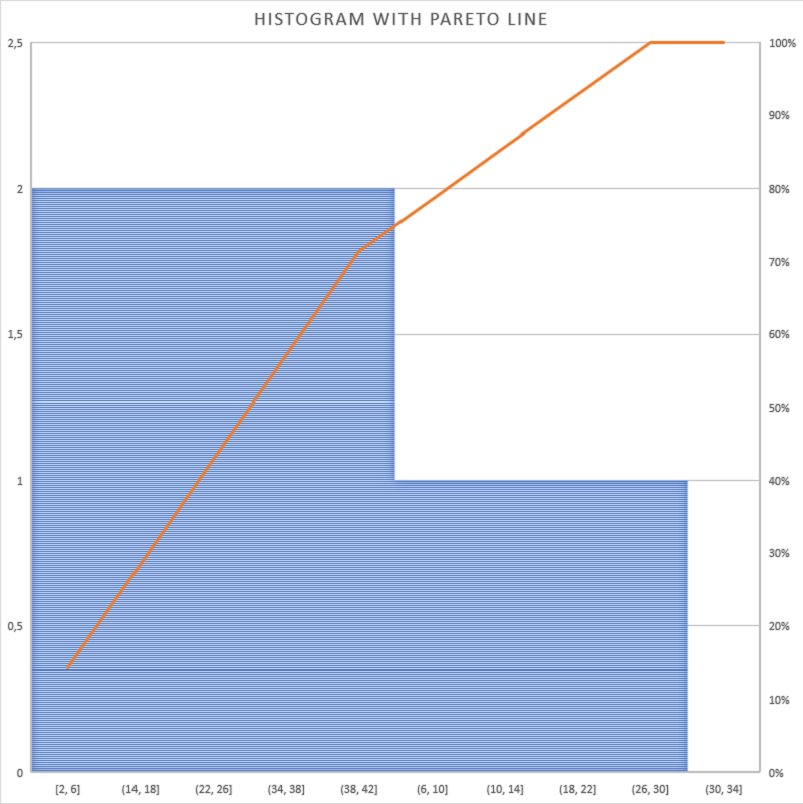
New chart types in EPPlus 5.2
Box & Whisker
Funnel
Histogram with Pareto line
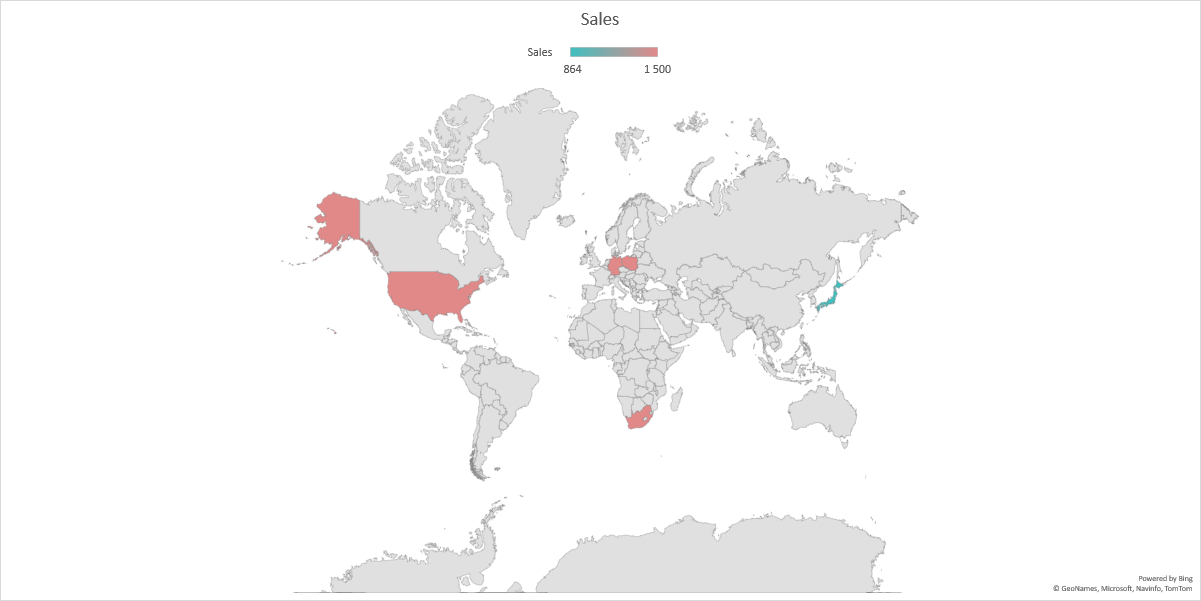
Region Map
Stockchart

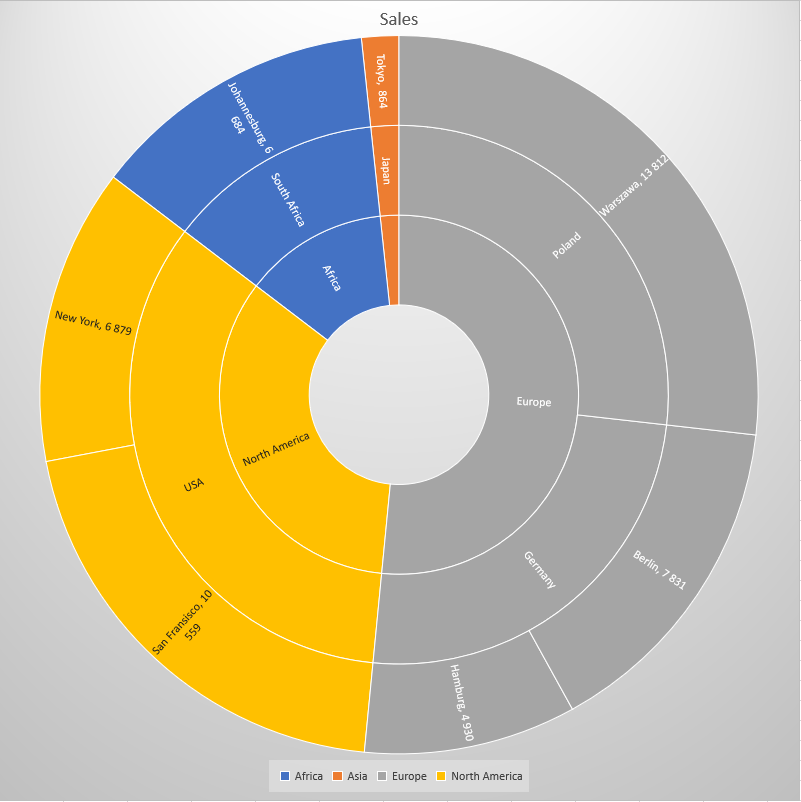
Sunburst
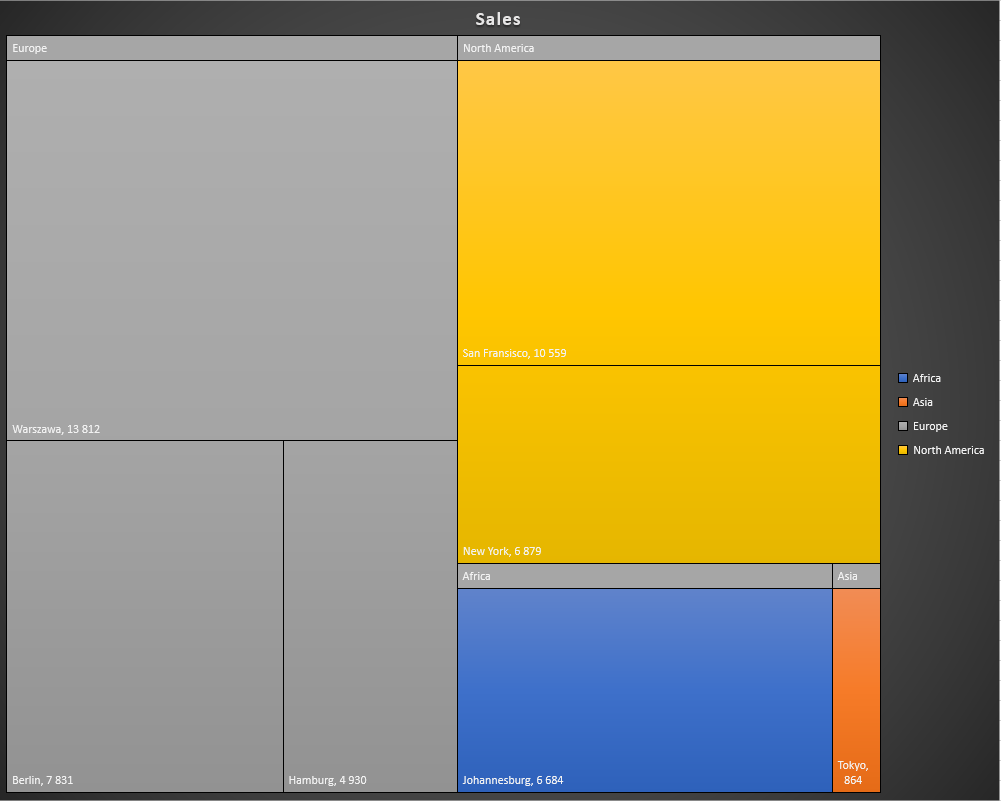
Treemap
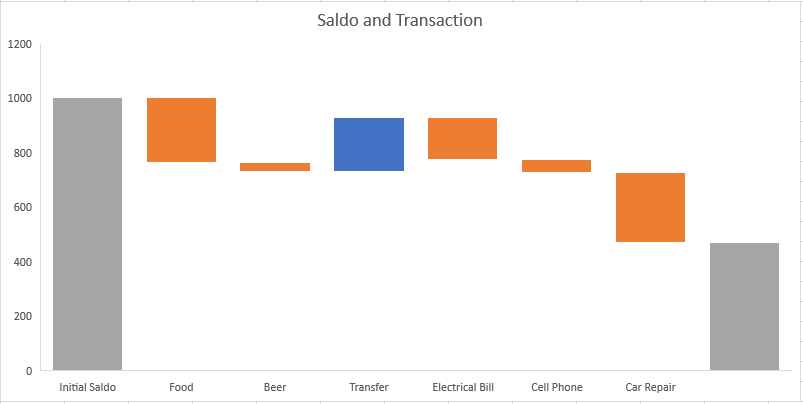
Waterfall
Other new chart types in EPPlus 5/6
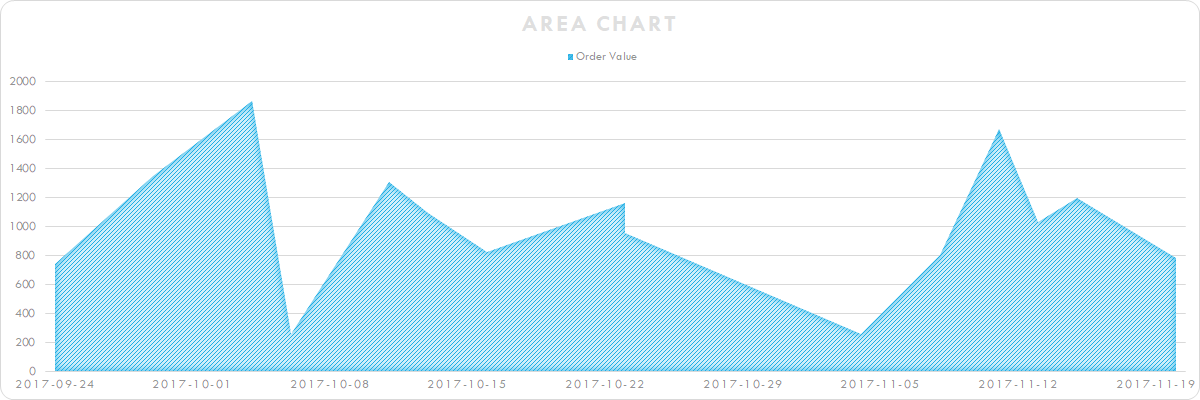
Area chart
This area chart uses the new feature to apply chart style templates (.ctrx files). Ctrx files can be exported from Excel.
            //Add an Area chart from a template file. The crtx file has it's own theme, so it does not change if you apply another theme.
            var templateFile = new FileInfo("AreaChartStyle3.crtx");
            var areaChart = (ExcelAreaChart)ws.Drawings.AddChartFromTemplate(templateFile, "areaChart");
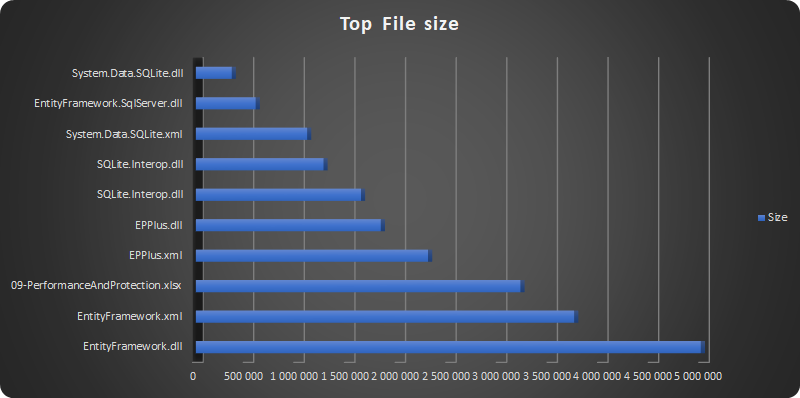
Bar charts
This 3D bar chart uses chart style 9 and the colorful palette 3
            //Set style 9 and Colorful Palette 3.
            chart.StyleManager.SetChartStyle(ePresetChartStyle.Column3dChartStyle9, ePresetChartColors.ColorfulPalette3);
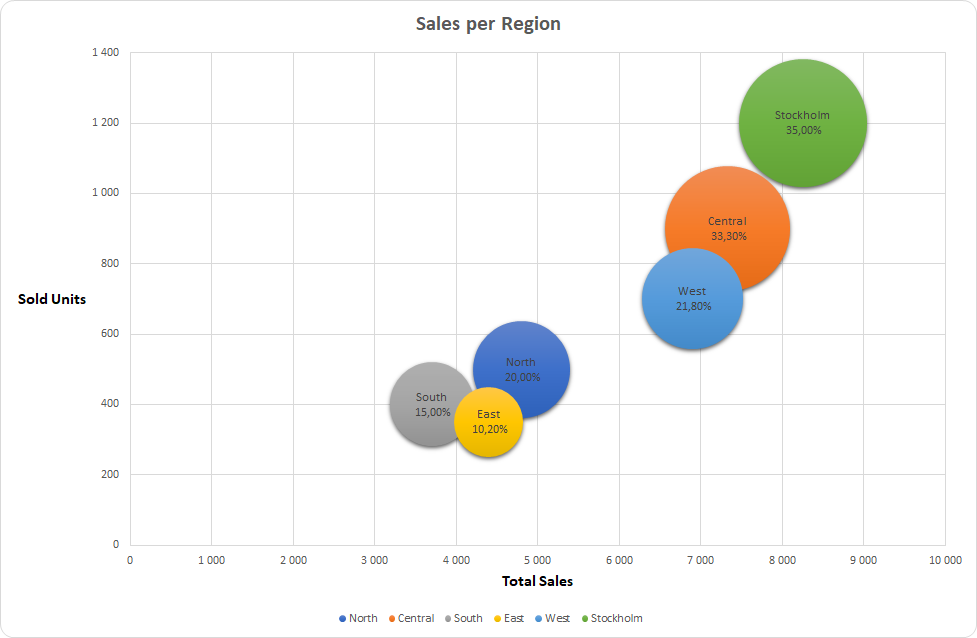
Bubble charts
These bubble chart sheets are from sample 15 and shows the different appearances depending on the theme
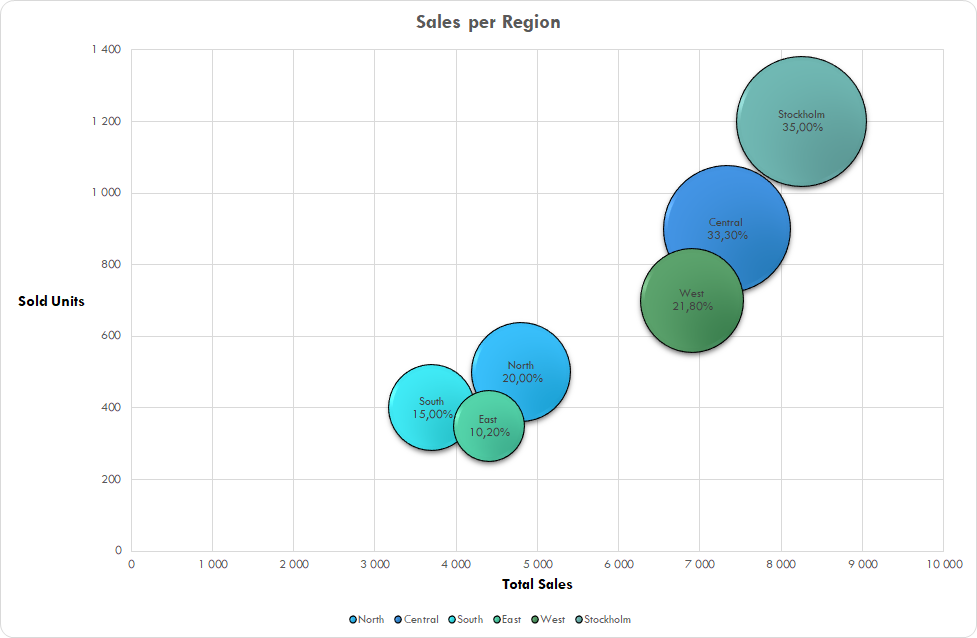
Bubble charts (with integral theme)
Here are a few more screenshots from the sample project showing different chart styles.
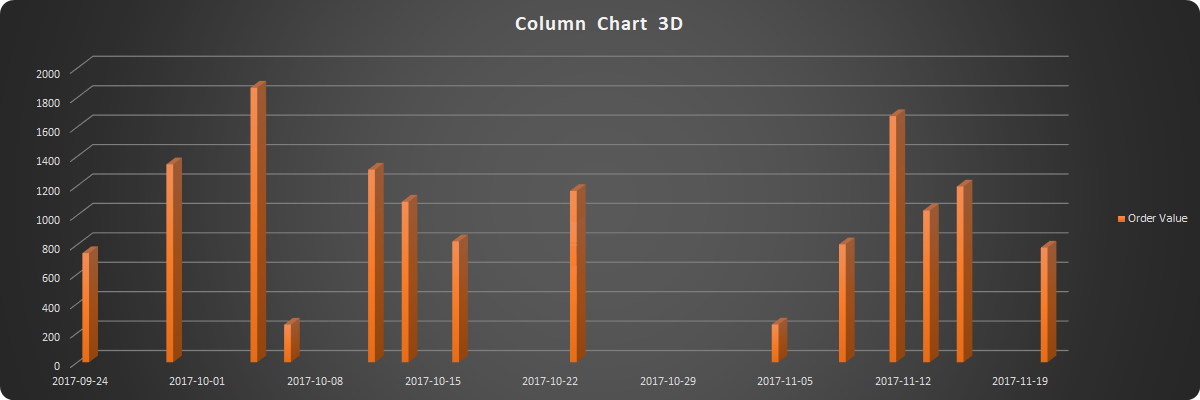
Column charts (3D), Sample 15
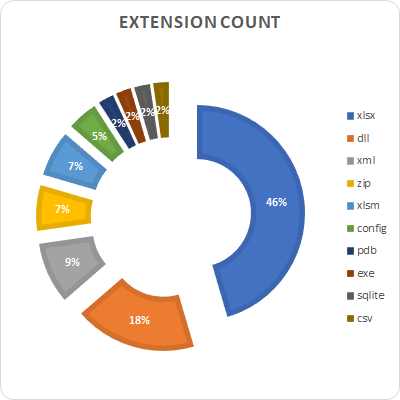
Doughnut Charts, Sample 20
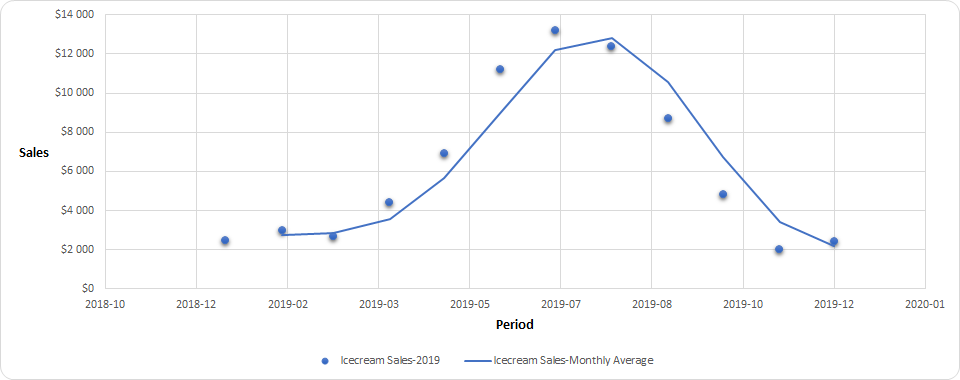
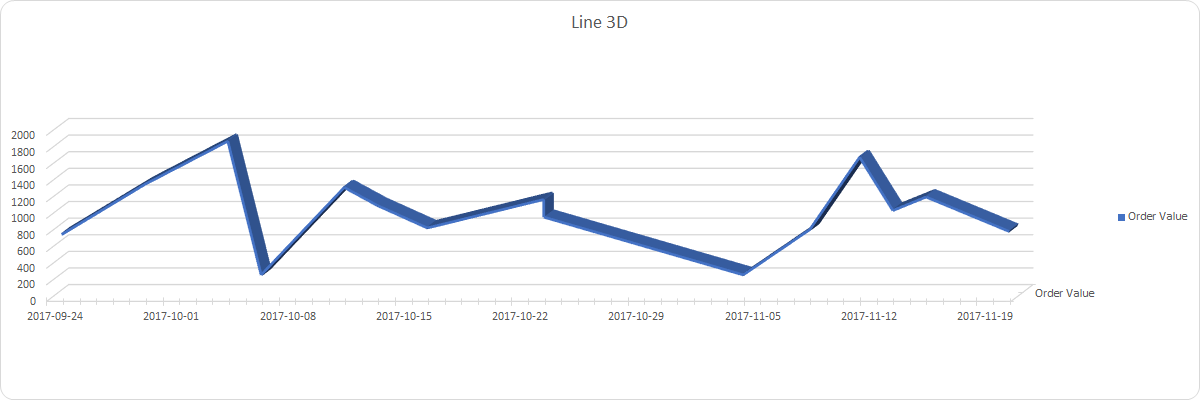
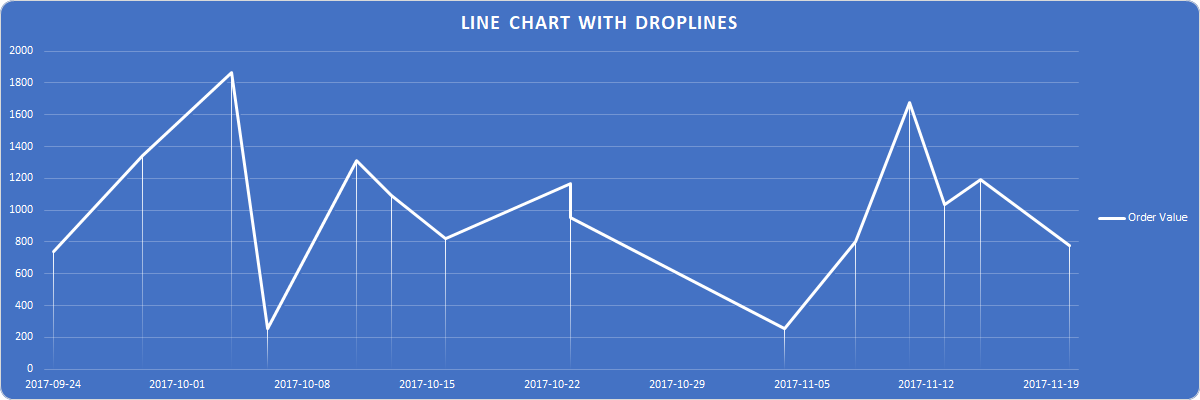
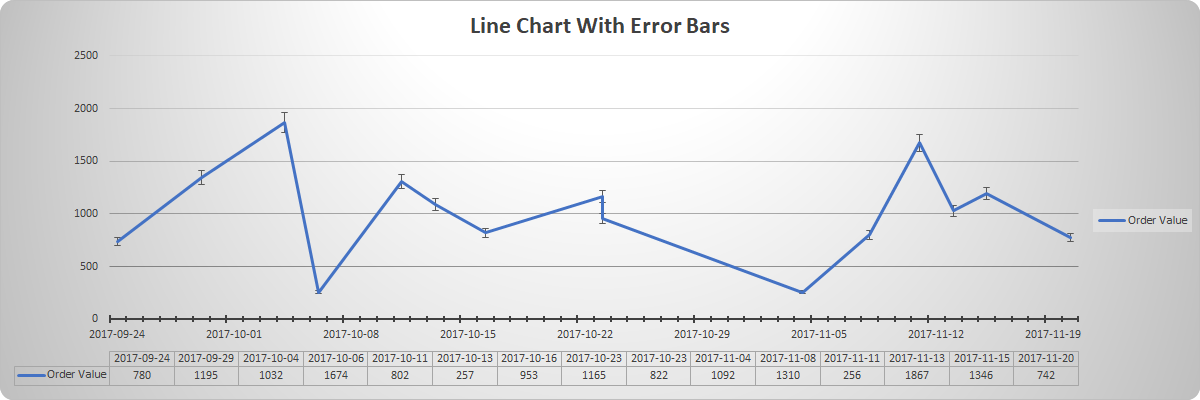
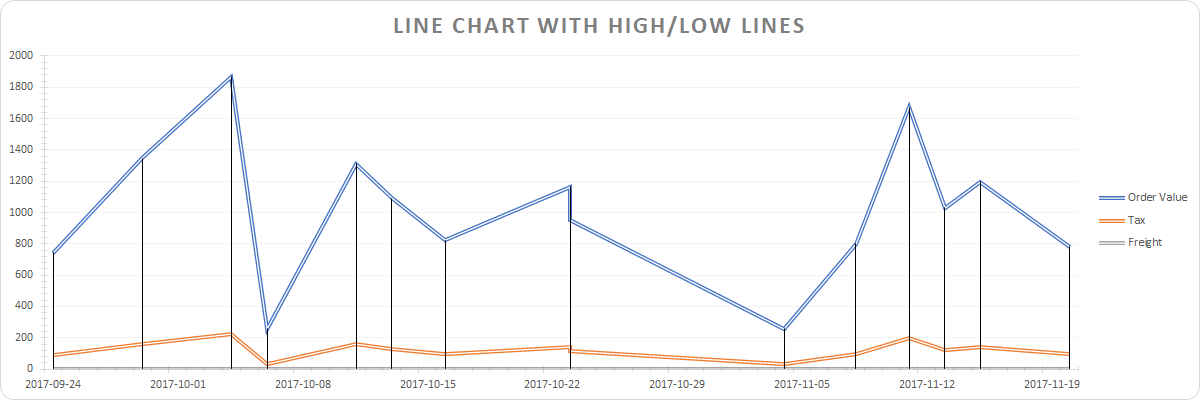
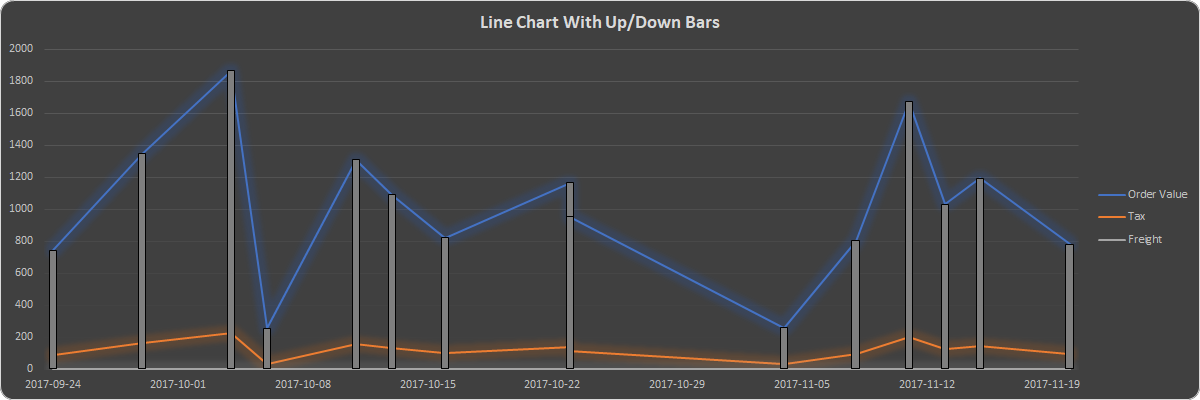
Line Charts, Sample 15 & 17
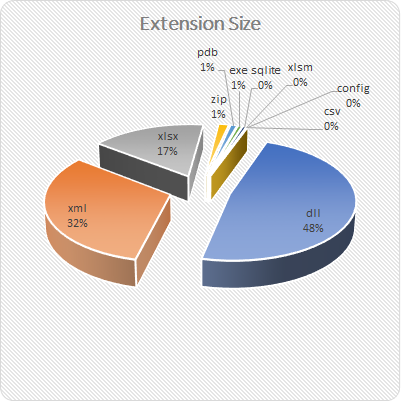
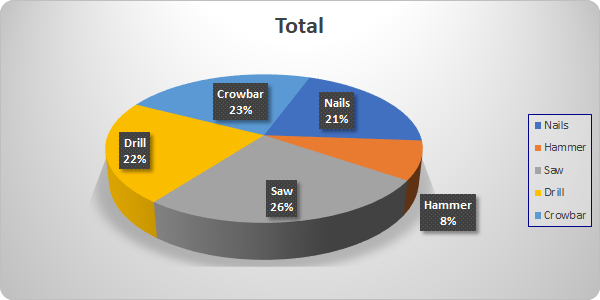
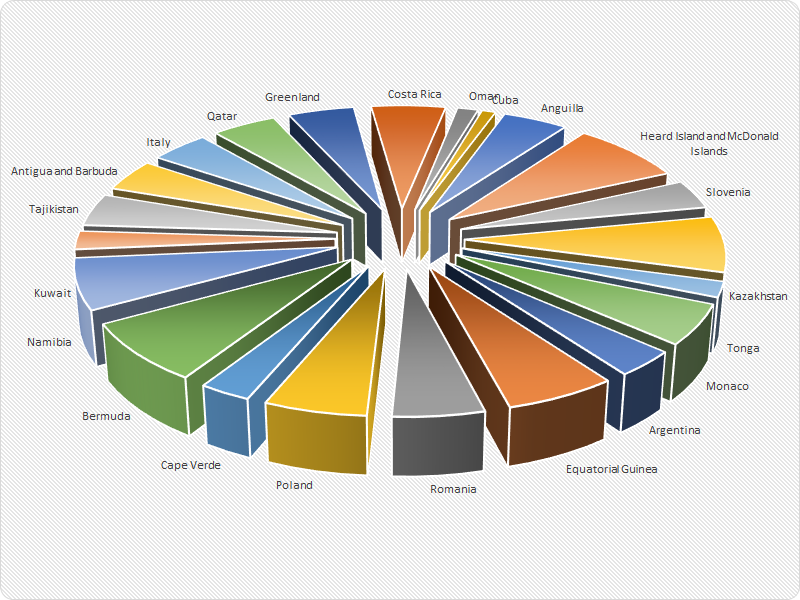
Pie Charts, Sample 7, 18 & 20
Pivot Charts
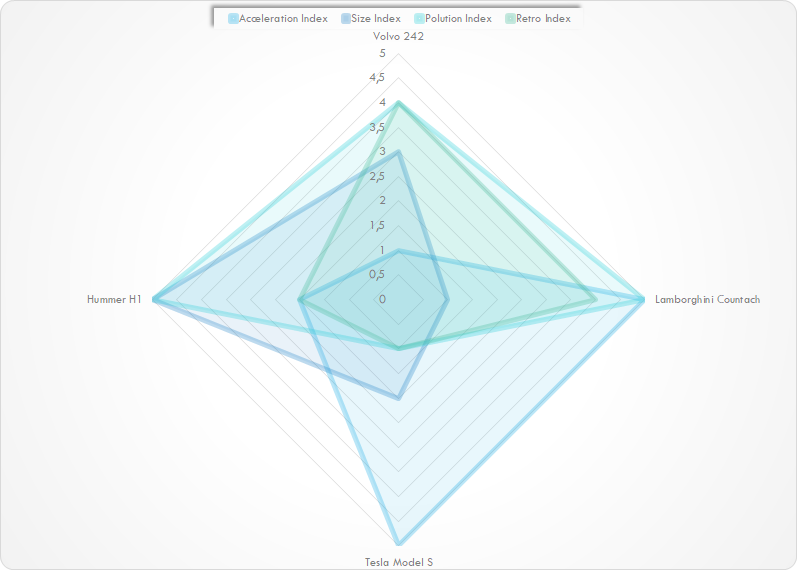
Radar Charts, Sample 15
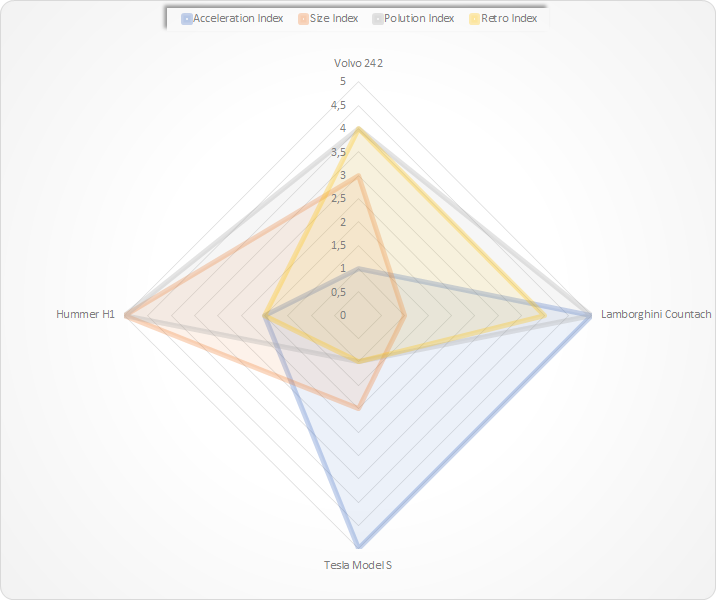
Radar Charts (integral theme)
Scatter Chart with trendline, Sample 15